Workspace Creation
To begin creating a dashboard in Chartmat, the first step is to set up a new workspace. This workspace will act as the foundation for your projects and data organization. By providing a unique workspace name and subdomain, you’ll create a distinct URL for your workspace. Once these details are entered, you can quickly finalize the setup by clicking the “Create Workspace” button, allowing you to efficiently manage and build powerful dashboards tailored to your needs.
New workspace
1.Click on Add New Workspace

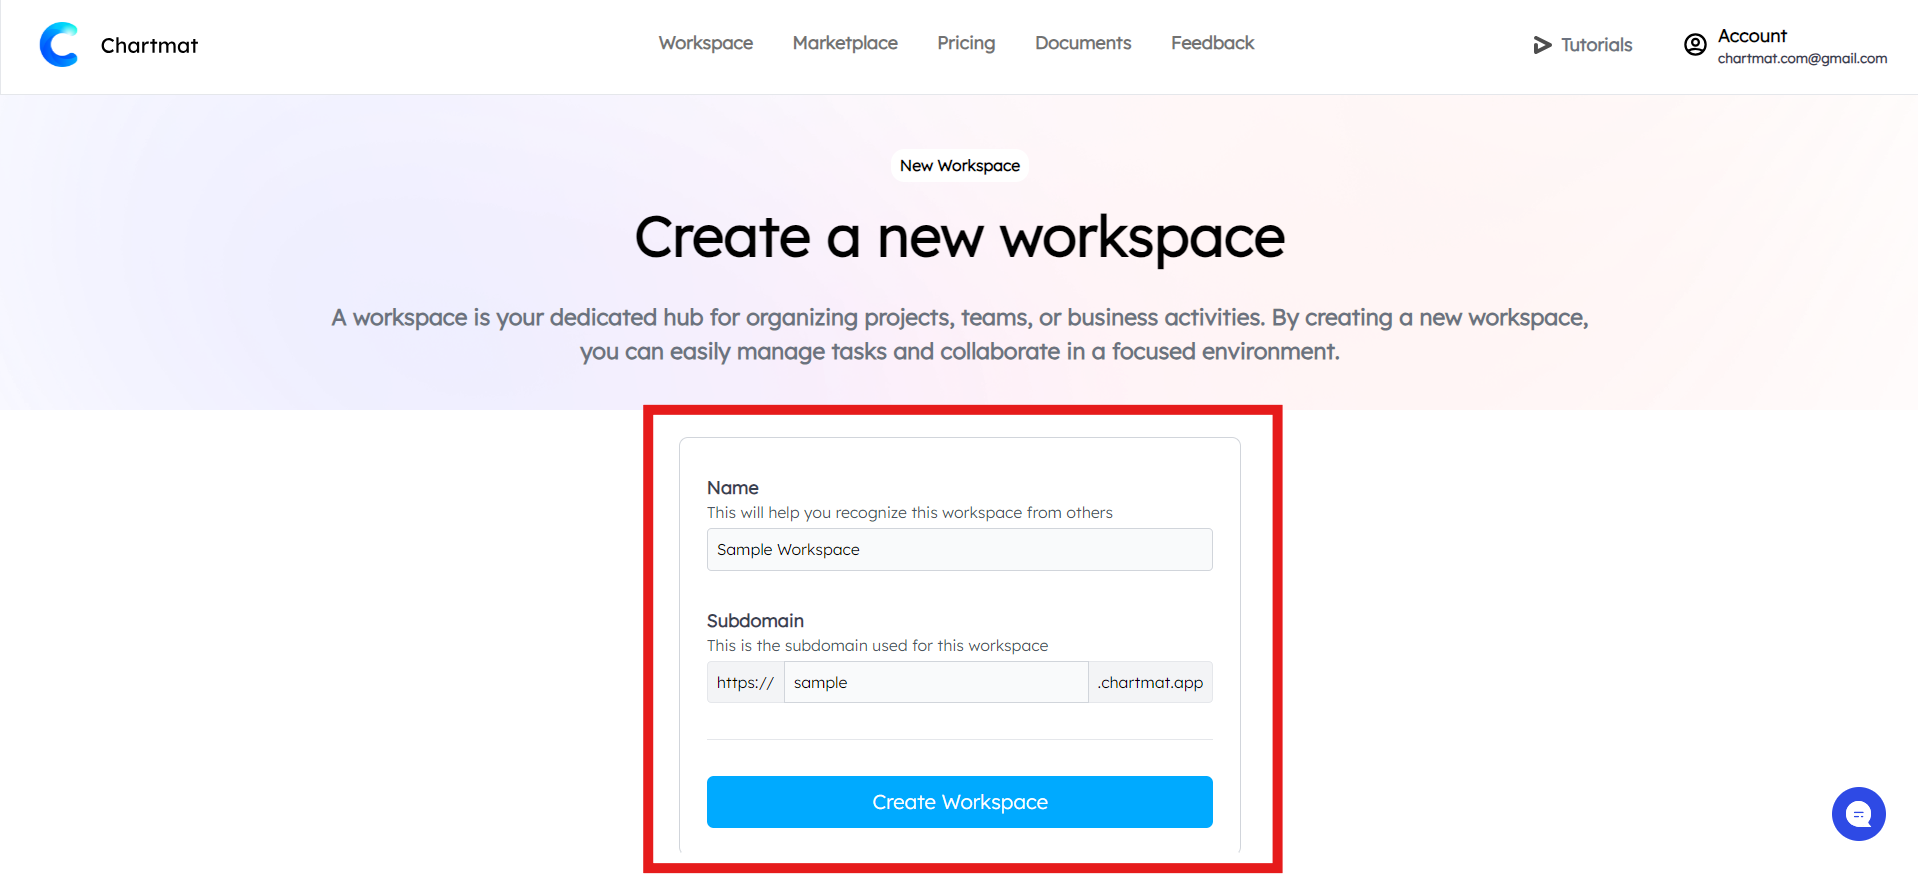
2.Add the details that required in workspace creation settings.
- Enter Workspace Name
In the field labeled “Name,” enter the name for your workspace. This will help you easily identify it among other workspaces.
Example: If your company is named “Sample,” you would enter “Sample” in this field. You can customize the name according to your needs.
- Set Your Subdomain
In the “Subdomain” field, enter a unique identifier for your workspace’s subdomain. This will create a unique URL for your workspace.
Example: If you enter “sample,” your workspace URL will be http//sample.chartmat.app.
Now press on Create Workspace button.

3.Create the Workspace
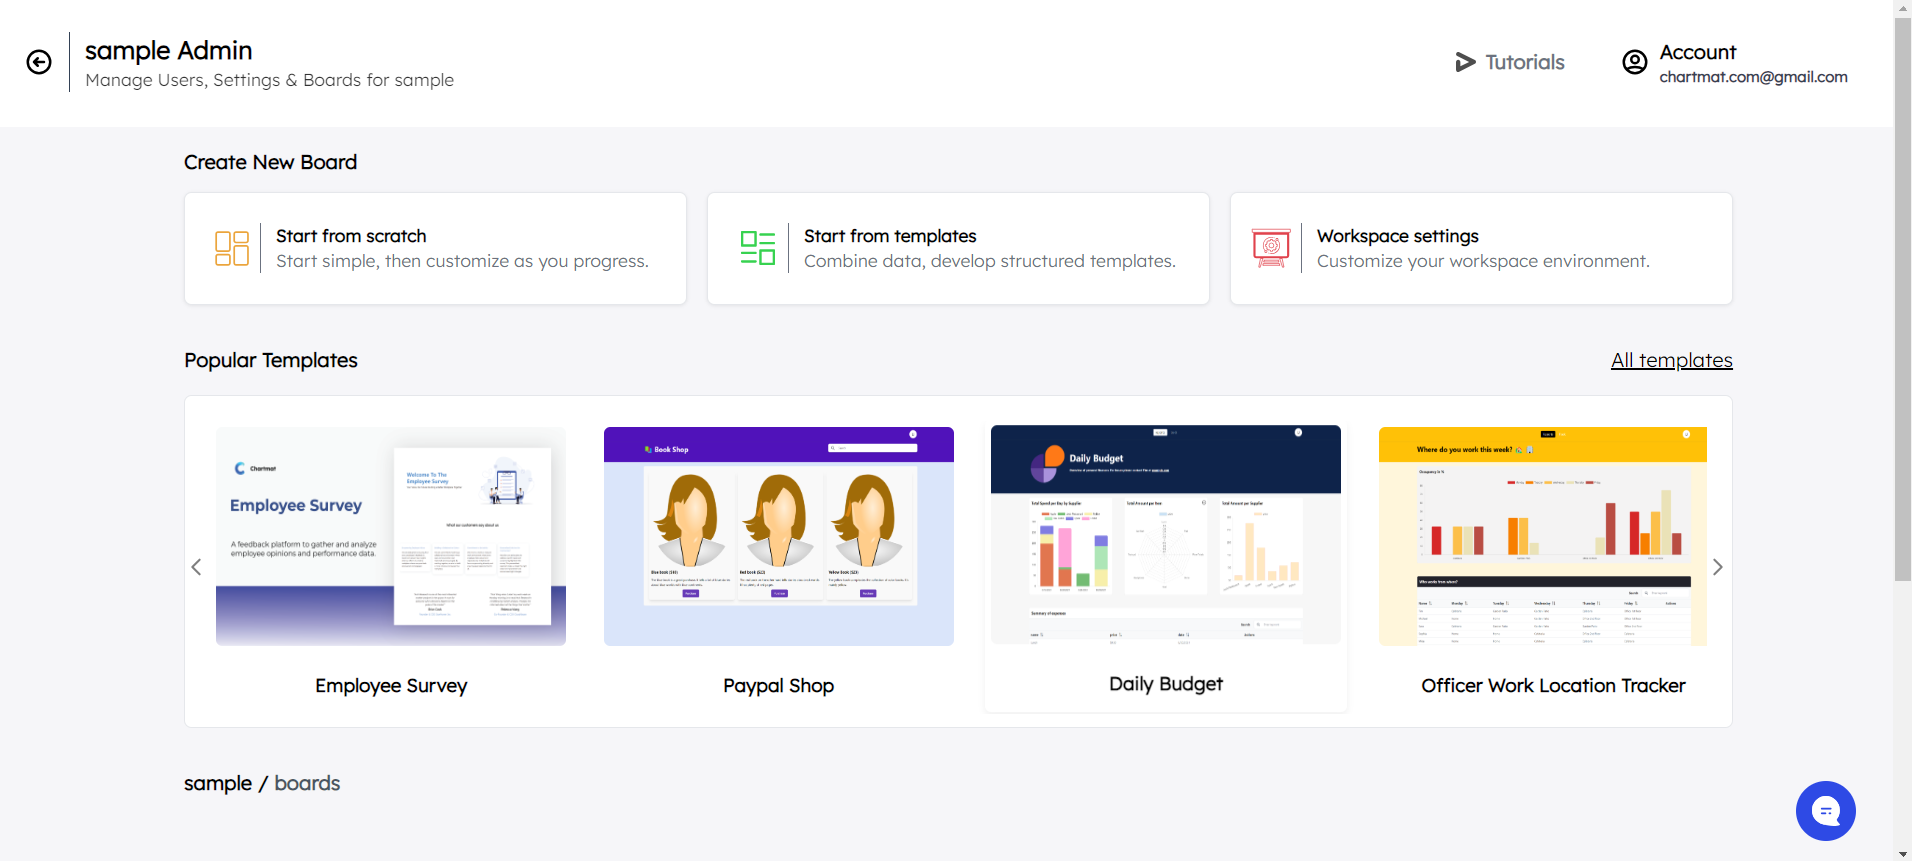
After entering the required details, press the Create Workspace button. Once your workspace is created, you will be directed to the dashboard.

4.Connect to Google Sheets
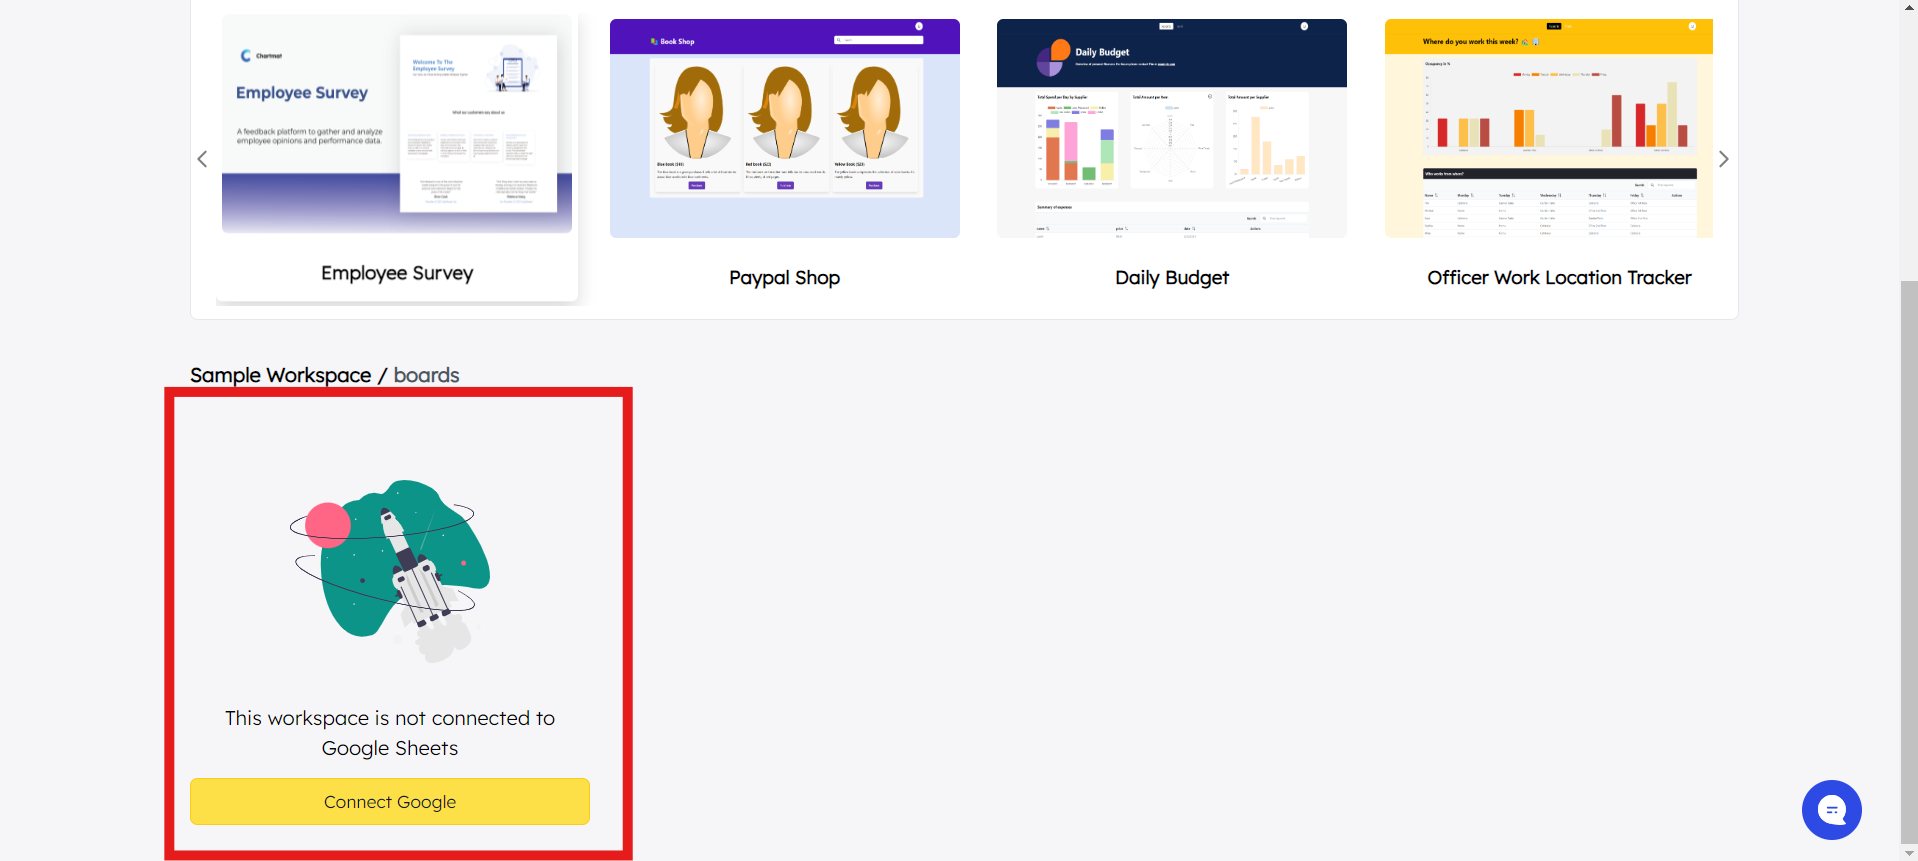
On the dashboard, you will see a section like the one shown in the image. This section indicates that “This workspace is not connected to Google Sheets.”
To connect the workspace to Google Sheets:
Click on the Connect Google button.
Follow the prompts to log in to your Google account and authorize Chartmat to access your Google Sheets.

5.Workspace Ready
Once connected, your workspace will be linked to your Google Sheets, allowing you to manage and sync data directly with Chartmat.
Now, you can create your board and transform it into an elegant, interactive dashboard, enabling you to visualize your data in a clear and engaging way.